 |
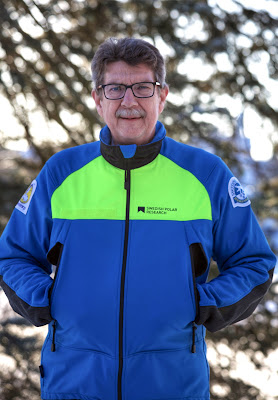
| Figure 1: Icework on sea-ice in the Arctic Ocean 26 August 2021 during the SAS-expedition. Photo by Sonja Murto. |
This beautiful picture with a circle of light - a halo - over the Icebreaker Oden (Fig. 1), formed by refraction of sunlight when hitting ice particles in the sky, was taken only 20 months ago during the Arctic expedition Synoptic Arctic Survey (SAS). That was my first time to be in the Arctic for almost 2 months - what an amazing experience! If you are reading my blog now for the first time - welcome! If you want to read (and see some cool photos) more about the last expedition, please visit my blog: Arctic-expedition Blog, especially take a look at the posting Why study Arctic climate? to know more about Why the Arctic is so important to study (it is actually one of the least understood and studied places on Earth!) and more about my background and interest in the Arctic climate.
Today I am starting a new blog because I was given this amazing opportunity to take part in another expedition into the challenging but beautiful environment - to the northernmost region of the Earth - the Arctic! Me, currently as a PostDoc at Stockholm University (SU), together with 38 other scientists from 10 different nationalities (and a crew of about 40 people) will get onboard the Swedish Icebreaker Oden and leave from Longyearbyen, Svalbard, on Sunday 7 May 2023 and head north for 6 weeks. This expedition is called ARTofMELT (Atmospheric rivers and the onset of sea ice melt) and supported by the Swedish Polar Research Secretariat (SPRS). I will tell you a bit about the WHY's and WHAT's below, but you can also read about the coming expedition on the webpage of SPRS, on the SU webpage or watch the Youtube video about the expedition.
--> The main purpose of this expedition is to be in the Arctic before the melting of sea ice starts and then capture the rapid melt onset.
--> We want to investigate which processes are involved in triggering sea ice melt.
--> For this, we want to obtain as much as observations from the spring and this rapid transition as possible. Observations from the Arctic are rare!
--> Our main target is to capture so-called Atmospheric rivers, narrow bands of warm and moist air transported in the atmosphere from the south towards the Arctic. We hypothesise, based on model- and a few observational studies, that these rivers are important triggers for the onset of sea ice melt.
--> We need to be in the Arctic on the right place at the right time, which requires collaboration with on-shore colleagues that will follow carefully the forecasted weather. Not only does the thicker ice-conditions in spring entail challenges, but also the planning of the route of the trip during the expedition will be challenging.
--> In-situ observations from the spring help us understand processes behind the sea ice melt onset and improve the process-based understanding in climate and weather models that still fail to represent the Arctic climate properly.
Now we get to the more detailed "Why's" and "What's" :)
Annual sea ice evolution and the important of melt onset to the ice evolution
 |
| Figure 2: Seasonality of daily Arctic sea ice extent (the area of the Arctic Ocean covered by at least 15 % sea ice) shown for 2023 (blue line), 2021 (orange line) and the record low year 2012 (red dashed). Further shown are the average extent over 30 years (1981 - 2010; gray line) and the variation of the data is shown by the gray shading (+/- 2 standard deviations around the mean). The data is obtained from the National Snow and Ice Data Center and accessed 2023-05-03. |
Figure 2 shows how the Arctic sea ice extent - i.e. the area of the Arctic Ocean with a sea ice cover of at least 15%, varies by month and year, with a clear annual cycle: maximum in March during the growing period and minimum in September during the melting period. In winter during polar night with no incoming solar radiation and the near-surface temperatures as cold as -40 degrees Celsius, the surface loses a lot of energy to the atmosphere and experiences freezing, whereas in summer during the midnight sun the surface stays at a the melting point (about 0 degrees Celsius) and receives more energy.
Thus, in the Arctic we usually talk about two seasons: winter with net surface energy loss and freezing and summer with net surface energy gain and melting. As the surface temperature stays fixed at the melting point in summer, all the excess energy the surface gets will directly go to melting sea ice. This energy is then stored in the ocean during summer to be released in the autumn. As can be seen from Fig. 2, the annual sea ice extent cycle for all years is not equal, but varies per years, with some years of smaller minimum extent in September compared to other years. In fact, there is a significant decrease in the sea ice extent over the Arctic Ocean that observed in all months, however, with a largest sea-ice decline seen in September. The dashed red line in Fig. 2 shows the cycle for year 2012, a year with a record low minimum September sea-ice extent. During SAS in 2021, we also had a low sea-ice extent in September, however, within the two standard deviations from the average (shown in gray shading). For this year, 2023, the sea-ice extent evolution resemble that from 2021 (blue line in Fig. 2), but how the extent evolves in summer and what the minimum in September will be is not yet known, as several processes, such as the atmospheric circulation in spring, affects the ice-evolution.
The negative trend in the Arctic sea ice extent is one of the direct consequences of the rapid surface warming that is observed in the Arctic - in fact, studies show that the Arctic is warming locally up to seven times faster than the global average warming trend (Rantanen et al. 2022). This phenomena is called Arctic Amplification. But sea ice loss is not only a response of Arctic Amplification, but also one of the factors that contributes to the amplification. This has to do with the properties of sea ice. White surfaces reflect majority of the incoming solar radiation back to space, so that only a little fraction is actually absorbed into the surface. Thus, we can think of new snow and sea ice as highly reflective surfaces - obtaining a high surface albedo - the more ice and snow, the more energy will be reflected away from the surface despite enhanced incoming solar radiation. However, when ice starts to melt or snow gets wet, the surface properties - such as the albedo - changes! Wet surfaces and open ocean are darker surfaces with a lower albedo, meaning that more solar radiation can be absorbed by the ocean (or wet snow) and less is reflected away. Thus, the declining sea ice allows for more energy to be absorbed in the oceans and the wet surfaces in summer, which in turn causes a positive feedback loop on the local warming, prolonging the summer melt period and further can lead to an anomalously low sea ice extent in September.
Why are we interested in going to the Arctic in the spring?
 |
| Figure 3: Trends in the timing of the melt onset over Arctic sea ice from 1979 to 2013. Figure adapted from Stroeve et al. 2014; Fig.2. |
Normally, when we think about spring, it usually lasts for a few months and the transition from winter to summer is therefore gradual. In the Arctic, however, this transition is rapid: a sudden transition from winter freezing and cold temperatures with a net surface energy loss into summer melting and a net surface energy gain with surface temperatures near zero degrees Celsius (as mentioned above). Interestingly, in "spring" as long as there is no melting occurring, the white ice and snow surfaces reflect so much of the incoming solar radiation that the surface is actually cooling. This is an interesting phenomena: when standing on the ice with clear sky conditions (no clouds) and the sun rays hit your face, you feel warm and think it the surface must be melting. However, due to the high surface reflectivity, the surface actually experiences net energy loss and is cooling (if no melting occurs)!
So why is spring so interesting? As mentioned, the transition into summer (into melt) in spring occurs rapidly in the Arctic. Once the melting has started, the so-called ice-albedo loop will be triggered, i.e., that darker and wet snow surfaces start to absorb solar radiation (instead of reflecting it away). The actual timing of WHEN this transition into melt occurs, i.e. the onset of melt, is thus crucial, as it determines the length of the summer melt period, how much energy will be stored in the oceans and how much ice there might be left in autumn before freezing begins. Thus, the timing of the melt onset affects the whole ice evolution in the Arctic and it is important to understand which processes are behind this rapid melt transition period to better understand the whole Arctic climate.
Studies show that the melt onset in the past years (from 1979) has started earlier, i.e. there is a positive trend in the melt onset dates. As seen in red in Fig. 3 (positive trends), locally (e.g. in Barents Sea north of Scandinavia and around Greenland) the onset of melt can be up to one month earlier per decade! Stroeve et al. (2014) also showed that during a five year period, the longer melt season and the decreasing surface albedo (less reflective surfaces) increased surface melting and allowed for more solar energy absorption, which was equivalent to melt more than 1m of sea ice!
When does melt begin in the Arctic? If we look at satellite-derived maps of melt onset dates averaged over 38 years (not shown: my paper of this submitted soon), there is a latitudinal dependency of when the sea ice melt begins: the more southerly ice begins to melt earlier than more northerly parts. At the ice edges and coastal areas, the melt begins on average in mid-May, whereas towards the North Pole and thicker-ice regions north of Greenland the ice melt begins in mid-June. However, if we look at annual maps (per year), the melt onset dates over sea ice look more patchy and discontinuous. Sometimes, ice-patches close to the North Pole can experience melting even before ice-patches to the south of them start to melt! But why is this? Well, this is exactly WHAT we, with the ARTofMELT expedition this spring, want to investigate: which processes lead to the onset of melt (so what provides the surface with so much energy that the melting state begins and stays without returning to its original, freezing, state?)? We would think that once the sun begins to shine, it will deliver so much energy that the surface must start to melt! Well, in theory yes, but then we might need to wait until mid-June for this to happen. But as mentioned before, melting can also begin in end May - and this during cloudy skies! But wait! More energy reaches the surface when we have clouds present? How is this possible? We might think that on a sunny day in spring, it feels warm when the sun is out (no clouds), but feels cold when the sun is behind a cloud. Yes, the clouds affect the shortwave (solar) radiation by reflecting back a lot of the incoming solar radiation and thus preventing it from reaching the surface. However, in the Arctic it is a bit different! In winter, there is no sunlight and the surface is cooling. But in spring and summer, the surface properties in the Arctic matters for the solar radiation - and again I return to the white ice and snow surfaces!
The amount of solar radiation absorbed into the surface in spring in the Arctic over white surfaces is so small, so that the surface is actually experiencing net energy loss and cooling. The net surface energy is not only dependent on solar radiation, but also other fluxes affect the surface energy balance. For example longwave (thermal) radiation - something every body radiates depending on their body temperature. During clear skies, the surface radiates a lot of longwave radiation that will escape into space. But during cloudy skies, the clouds trap part of the outgoing longwave radiation and redirects it back to the surface. Thus, during cloudy skies in winter - as we might know it - it is actually warmer at the surface than with no clouds!
So, with clouds in spring, we can allow for more energy to be directed towards the surface and this might trigger melt onset? But what can bring moisture into the Arctic? This is where the hypothesis of warm- and moist airmasses, so-called Atmospheric rivers, comes into place. What are they and how can they affect the surface properties in the Arctic?
What are atmospheric rivers?
 |
| Figure 4: An example of an atmospheric river (purple arrow; shading shows the total column water vapour, i.e. the sum of the water vapour in the atmospheric column; kg/m2) penetrating into the Arctic from the Northern Atlantic in mid-December 1986. The occurring atmospheric circulation is schematically shown by arrows and "L" and "H" for low- and high-pressure systems, respectively. Note how dry the Arctic is, except for the narrow band of moisture in the atmospheric river. Figure is adapted and modified from Murto et al. 2023; Fig. 3. |
If we think about the energy transport in the global climate system on a more basic level, it all goes down to the uneven distribution of energy from the sun. The climate is basically determined by the balance between two factors at the top of the atmosphere: how much of the incoming solar radiation is absorbed in the Earth's climate system and how much is lost in space by outgoing longwave radiation. As polar regions receive less energy compared to the equator, the poles will lose more longwave radiation to space compared to what is absorbed by shortwave radiation. This uneven distribution of solar radiation results in an energy deficit in the polar regions! As the Earth always tries to balance such imbalances, energy must somehow be transported from the equator (with net energy gain) towards the poles (with net energy deficit). This energy transport is then happening in the oceans and in the atmosphere, from which the atmosphere is dominating the transport north of 35N (suggested by observations and models). The energy transport occurs during all times in the year, but is largest in winter (when the temperature difference between the equator and the poles is the largest). Atmospheric energy transport, i.e. the transport of warm air northwards and cold polar air southwards, is carried out by longer-lived high-altitude winds, but also by shorter-lived weather systems embedded in the large-scale circulation patters. These weather systems are something we maybe remember seeing in the news on the television on weather maps (fronts with low-pressure (L) systems coloured by red and blue lines with red half-moons and blue triangles for the warm and cold fronts, respectively, usually associated with a lot of rain, as well and high-pressure (H) systems). These weather systems help transport heat and moisture into the Arctic.
But most of the northward energy transport occurs in narrow bands, transporting a lot heat (and moisture) into the Arctic. These events of intense moisture transport are episodic (does not occur that frequently: in winter about once a week) and are usually called "warm- and moist-air intrusions" or more describing as "Atmospheric rivers". The latter basically describes what they are: narrow rivers in the atmosphere that bring moisture. Moister air is always warmer than drier air, so this air is not only moist but also warm (note that airmasses entering the Arctic can also be only warm and not moist, but still affecting the surface over sea ice). Figure 4 shows an example of one Atmospheric river entering the Arctic in December. The shading nicely shows how narrow these injections are - the red color is concentrated in a narrow band surrounded by drier (blue) air. We can also see from this figure (schematically) that these Atmospheric rivers are driven by weather systems: a low-pressure system to the left circulating anticlockwise, and a high-pressure system to the right of the river with an clockwise circulation. Imagine this and you might get a picture of two rotors circulating in opposite directions, so that the airmass in-between has a clear pathway into the Arctic.
But how does these Atmospheric rivers affect the Arctic and why are they hypothesised as triggers for melt onset over sea ice?
 |
| Figure 5: Schematic of the mechanisms related to injections warm- and moist air, so-called atmospheric rivers, that affect the Arctic surface temperature, surface energy fluxes and sea ice evolution. Adapted from the Doctoral thesis from Sonja Murto (2022). |
Figure 5 summarised different processes, both remote such as these atmospheric rivers that enter the Arctic from the mid-latitudes and local such as local cloud formation, in the Arctic climate system affected by warm air pulses from the south. The Arctic is normally cold and dry. However, when these injections of warm and moist air enter the Arctic, they transform the original cold and dry state into a more moist, warm and opaque (cloudy state). The moisture that is transported by these Atmospheric rivers into cold polar air condenses and this favours local cloud formation in the Arctic over sea ice. This transformation of the Arctic atmospheric state has a strong impact on the surface and the local surface energy budget: warmer air loses heat towards the surface, which is shown by the arrow indicating enhanced turbulent heat fluxes in Fig. 5. So, warm air can also bring lot of energy towards the surface. The radiative fluxes, in this case the downward longwave radiation, is enhanced by both the warmer and moister air (recall "greenhouse effect" by trapping more heat towards the surface) but also the local cloud formation increases the energy towards the surface. All together, these atmospheric rivers, coming from the south with its warm and moist air, provide energy towards the surface and thus reduce the surface energy loss that is normally seen in the Arctic in winter before melt. This energy input towards the surface in winter can then go into increase the surface temperatures (if they are below freezing; as is the case in winter), or go into delaying ice growth or even induce temporary melting if freezing temperatures are reached. So despite the infrequency of these atmospheric river events, they can delay ice growth in winter because of the intense energy input towards the surface. As sea ice has a memory, the delaying of ice growth can also persist even though the intrusion already passed away. In winter, however, the surface will return to its cold and freezing state (or at least colder than by the influence of the moist-air pulse) once the time has passed after the moist-air pulse has gone away.
But what about spring and the transition into melting / summer in the Arctic and its relation to these atmospheric rivers? Well, same process as described above is important, but so that the surface will not return to its original state but "falls into" and stays in the melting state, which was originally triggered byt an atmospheric river crossing over the Arctic sea ice. So this is why we call it the "trigger" - we only need this opaque, cloudy, moist and warm state affected by the atmospheric rivers to occur in the perfect time, so that the extra energy input towards the surface is so intense to bring the surface to melting temperatures and trigger the melting to stay that way, even though the river has passed away. When these atmospheric rivers happen in May, they can thus kick-off the melting even before the sun does it (maybe in end June). Returning to Fig. 5, these warm- and moist air pulses in early spring can thus lead to earlier melt onset in spring, which as explained before, has consequences for the summer melt season (the amount of energy absorbed and ice melted), and thus affects the whole Arctic ice-evolution. In summer, they can also enhance sea ice melt.
Atmospheric rivers doesn't only transport moisture and heat, but also air-born particles, so-called aerosols. These are also important for the local Arctic climate, as the Arctic is usually quite clean. These aerosols affect the radiation (depending on their size or characteristics; e.g. black carbon is black and thus an absorbing aerosol) and are also important for the cloud formation. For clouds to form, the moisture is not the only important factor, but the moisture once it begins to condense, needs to have a surface over which it can condense. These aerosol particles suspended in the air are great for condensation nuclei for clouds. Aerosols are thus also an interesting topic to study.
So studying these atmospheric rivers is important and acts as the basic for our expedition to understand them better: their effect on the Arctic surface energy budget and what happens in the atmosphere, surface, snow layer and the uppermost layer of the ocean - especially in spring - and to observe (and confirm?) their link to the sea ice melt onset. But how can we know when and where these atmospheric rivers occur? This brings us to the challenges of the expedition.
Challenges - no specific route planned yet!
Because atmospheric rivers are driven by weather systems, our route is also largely dependent on the prevailing weather conditions - when do we have a circulation pattern resembling that shown in Fig. 4 with southerly winds bringing moist and warm air into the Arctic? Well, we cant know now for the next 6 weeks when this happens and the exact route of the rivers once they occur, as the atmosphere is chaotic. Thus, there is no specific route planned yet - which makes the expedition even more exciting! We do have a target region, which is shown by the black triangle in Fig. 4: somewhere within the triangle between northern Greenland, north of Svalbard and the North Pole. But where to go first? We want to be in the ice before the melt begins, but we also don't want to be too much north so that we need to return to Svalbard (15 June) before the melt even started. So south enough but also north enough...
To make a decision for the route requires collaboration with our on-shore colleagues. They will follow the weather closely (as we up in the Arctic have limited (or no) internet connection) and look at 10-day forecast data to see if a wanted weather is predicted to occur in the coming days. We also have a trajectory model (a model that follows air parcels in time and space) that runs on forecast data so that we can determine the predicted route of an atmospheric river (in case of one).
So, every morning the new forecast for the next 10-days is available, and a decision is made (whether or not to move and if yes, where) based on the weather forecast. But our route is not only determined by the weather, but also the ice-conditions: even though the Icebreaker Oden is strong and can break thick ice, there is still a threshold and we cant thus go everywhere. For example, north of Greenland is known for multiyear and thick ice, so the ice-thickness can also act as a spatial limit. Furthermore, also political borders impact our route. Even though the weather would seem promising for the coming 4 days, the final decision of moving to a wanted position comes from the captain of the ship.
If forecast data suggest of an atmospheric river that would enter the Arctic lets say 150 km east of where Oden is located in 4 days, and the captain assesses that we can move there, a decision of move is made. If we have instruments on ice, we need to collect and pack them and bring back to Oden so that we are ready to leave. For 2m thick ice, Oden can travel around 2knots, which makes around 85 km a day. The wanted location in this example could be reached within 2 days from departure. Of course, ice conditions changes along the trip and the more reliable route and speed we can have will become clear while heading to the target location. For the next day, a more accurate forecast could maybe suggest another route of the atmospheric river, so that the final destination might change on-the-go.
So, it will be challenging to be on the right place (underneath an atmospheric river) at the right time to be able to do measurements at the location of an atmospheric river. Anyways, we hope (and can expect) for at least a few atmospheric rivers during our 6-weeks time in the sea ice in the Arctic Ocean, but capturing one requires lot of collaboration and planning en-route. We won't be rolling our thumbs and waiting for one river to pass, but we'll of course be doing observations as much as possible during the whole expedition. When stopping in the ice, instruments can be run on Oden, work can be done in containers on Oden and ice-stations with instruments brought onto the ice can be built. We will also launch weather balloons that carry sensors that measure the vertical profile of the atmosphere (pressure, wind, temperature and humidity). The output of these radio soundings, as they are called, will then be sent directly to the Global Teleconnection Systems to be incorporated in the weather forecasts. Having just one more observation point in the Arctic Ocean improves the forecast for the coming hours/days quite much. In general, any observations made in the Arctic is valuable because observations are so rare. This brings us to the wanted outcome of this expedition.
What are the wanted outcomes of our expedition?
The main goal of our expedition is to understand processes that are behind the melt onset, what is the influence of atmospheric rivers on clouds and aerosols etc. The Arctic is one of the least understood places in Earth and our understanding of mechanisms and processes rely on observations. These observations from the Arctic are rare (as it is only covered by sea ice and ocean and no land) and restricted to former expeditions. Because of the annual cycle of the sea ice extent (recall Fig. 2) the Arctic is easily accessible in summer and early autumn, which is why most of the previous campaigns have been in summer. Thus, observations we have from the Arctic are both temporally (to the time of the campaign) and spatially (to the route of the Icebreaker) restricted. There are only a few one-year lasting expeditions, but no expedition since a few decades that has targeted the spring. Compared to the freeze-onset, that occurs in autumn when the Arctic is best accessible due to the lowest ice extent and thinnest ice, observations from the onset of melt in spring (during opposite conditions) are rare.
As the processes in spring, such as the rapid transition from winter to spring, i.e. timing of the sea ice melt onset, are important for the whole Arctic climate system, more observations are needed to better understand processes that occur in the Arctic. In fact, climate models succeed in predicting a warming trend and a negative trend in the sea ice extent in the Arctic, but the magnitude of the Arctic Amplification (warming in the Arctic larger than globally; see above) and the size of the sea-ice loss are not captured by models. This indicates that the processes behind are not well understood - especially processes that act on smaller scales than the model resolution, such as clouds and aerosols and their interactions - and more in-situ observations are needed to improve our process-based understanding and thereby improve their representation in models. So one of our goals is just to gather observations from the Arctic!
One of the factors behind Arctic amplification is changes in the energy transport - which makes this expedition even more important by targeting these atmospheric rivers that account for most of the energy transport into the Arctic. In order to predict the future Arctic climate, a better understanding of the current state and processes occurring in the Arctic are needed. We hope that by going into the Arctic in spring and target the onset of melt and processes behind it - something that has not been done before- will give us many new observations that we can analyse and use the knowledge to improve the process-understanding in our weather and climate models to better represent the Arctic climate.
"Join" our expedition by following this blog - I promise for great photos and any updates on the search for atmospheric rivers.


Comments
Post a Comment