Expedition overview - did we succeed? An interview with the Chief Scientist Michael Tjernström
To make an expedition happen, a lot of planning and collaboration work are required. Even though everything would be ready, it might still not go as planned once the expedition is on-going. The environment in the Arctic challenges the completion of the plan: will the ice conditions be favorable for us this year? How is the weather going to be? Will we be able to observe what we came for? There are many things we can plan for, but in the end the conditions while being out in the Arctic determine what can be accomplished for of the original plans and decisions need to be made based on the available material.
On many of the questions above I could give you an answer to as I together with 37 other scientists took part in this spring’s 6-week long expedition called “ARTofMELT” (8 May to 16 June 2023) and got to experience how this expedition eventually turned out to be. But to get the best insights and thoughts about the progress of the expedition, I interviewed the expedition Chief Scientist Michael Tjernström (currently professor at the Meteorological Department at Stockholm University; see photo below) on the Icebreaker Oden during the transit towards Svalbard shortly after we had left the sea ice edge on Tuesday (13 June) afternoon. Michael is an experienced polar scientist who has participated in five Arctic expeditions (including this one) and helped with the setup and was a shore-based Principal Investigator (PI) on three additional expeditions during his lifetime. In this last blog-posting, I will give you an expedition overview by the help of a cruise track (Fig. 1), a timeseries of air temperature and wind speed measured on Oden (Fig. 2), a satellite image showing the ice conditions blended in with mine and the Chief Scientist Michael Tjernström’s impressions of this spring’s expedition ARTofMELT2023.
 |
Michael Tjernström, professor at the Department of Meteorology at Stockholm University, was the Chief Scientist of the Arctic spring expedition ARTofMELT2023. Photo by: Stella Papadopoulou. |
Cruise track
I will start with a short description of the final cruise track (see also Fig. 1). We got onboard the Swedish Icebreaker Oden in Longyearbyen, Svalbard, on Sunday 7 May, but did not leave the fjord until late Monday evening (8 May). We headed northwards and saw the first icefloes floating by around 79N west of Svalbard at 11 am UTC on Tuesday (9 May; see black star on the blue cruise track in Fig. 1): we had reached the sea ice edge! We headed northwestwards and for the first week we tried to get north, occasionally even moving southwards to find a way through the large icefloes. We passed 80N but could not get beyond 80.5N.
One week after departure, at midnight on Tuesday (16 May; northern red star in Fig. 1), we stopped between Greenland and Svalbard around 80N at a larger icefloe to build our first ice camp. The ice camp #1 lasted for 6 days, during which we had again drifted southwards below 80N. We left the ice floe on Sunday 21 May at 23:00 UTC (southern red star in Fig. 1). Hereafter followed several (failed) attempts to go north (see two loops in the cruise track closest to Greenland in Fig. 1). A decision was made to head back eastwards towards Svalbard and then once again try to head north, but this time east of the zero-degree longitude (if the ice conditions allow).
Within a few days we had reached a new northerly location, where the second ice camp was built on an icefloe that was found around 19 UTC on Sunday eve (28 May; northern blue star in Fig. 1). The second ice camp lasted for 14 days and we were drifting with the icefloe southwards, before we left the icefloe on Sunday (11 June) afternoon around 16 UTC (see southerly blue star in Fig. 1). After staying stationary due to the storm on Monday (12 June), we then started to head back towards Longyearbyen, Svalbard.
Due to the southerly position at the end of ice camp #2, we were already surrounded by individual icefloes as characteristic to the marginal ice zone (at the sea ice edge). We left the ice edge around 6:30 UTC on Tuesday (13 June) morning (see black star on the red cruise track in Fig. 1) and arrived at Isfjorden in Svalbard later on Tuesday evening. Oden was cruising in the fjords on Wednesday (14 June) until we were allowed to dock outside Longyearbyen on Wednesday eve. The majority of us left Oden early Thursday (15 June) morning.
 |
Figure 1: Cruise track of ARTofMELT shown from 8 May 00 UTC (blue track color) to 13 June 16:00 UTC (red track color). We left Longyearbyen (Svalbard) late on Monday (8 May) eve, saw the first icefloes close to the sea ice edge on Tuesday (9 May) at 11:00 (first black star on the blue track) and left the ice edge at the end of the expedition on Tuesday (13 June) at 6:30 UTC (second black star on the red track). Stopped for the first ice camp on Tuesday around midnight (16 May 00 UTC) until Sunday (21 May) evening at 23:00 (red stars). The second ice camp lasted from Sunday (28 May) eve at 19:00 until Sunday (11 June) afternoon at 16:00 (blue stars). Dates are also marked with horizontal thin lines on the colorbar with respective colors. |
So, this is what happened – but was this the route that was planned?
“The expedition did not turn out as we had planned,” Michael explains, “and this can be separated into two main points”. According to Michael, the first point specifically concerns the final route of Oden – which did not turn out as planned. “I wanted to go north, maybe up until 84N to be well surrounded by sea ice, but we stayed between 79-80N for almost the entire cruise,” says Michael. The main reason to why it was so hard to get further north was the ice conditions and huge mega-ice floes. “From Oden we had access to charts showing the sea ice concentration in the Arctic Ocean. But, of course, these maps don’t tell anything about the thickness of the ice”, says Michael, “and we had to make decisions based on the material that we had access to. Making decisions ‘on-the-go’ is hard and sometimes the decision that at the moment feels like the best/right one only afterwards turns out to be the wrong one”.
 |
Satellite image showing the challenges for the expedition imposed by the ice conditions during the first ice camp. Image from Denis Demchev and modified by Michael Tjernström. |
“During ARTofMELT, we had two longer ice camps (6 and 14 days, respectively),” says Michael, “The location of both camps were determined by the sea ice, that blocked our way northwards and made us stop at more southerly locations than planned because we had nowhere else to go at that moment”. In the first case, a decision was made to pass the larger icefloes by taking a more westerly route and then find a way northward. However, the huge icefloes blocked our way northwards and we got essentially trapped. On the satellite photo above, you can see the two huge floes. “The route northward was unpassable, even with areas of open water,” explains Michael, “and the risk of getting permanently stuck was too high, which forced us to stop where we were and build our first ice camp”. In Fig. 1 you can clearly see our attempts to get north after the end of ice camp #1 (see the loops in the cruise track after the second red star). “We found a way to pass the huge icefloes, but in the end, it also did not help and we had to back out, heading back east and then north,” Michael explains,” The easterly way northward seemed to be a better choice and we had already spotted a new icefloe around 81N for the second ice camp. But again, the ice press forced us to stop and another decision had to be made: do we wait for another day to maybe gain another half a degree northward or do we stop here, build our second ice camp and go to work?”. The decision was to stop and start the ice camp #2. The ice conditions – the size or the pressure of the ice – determined for the both cases where we had to stop for our ice camps – and eventually determined the final cruise track.
The unplanned westerly route at the beginning of our expedition implied also other issues: suddenly we were too close to Greenland within the Danish exclusive economic zone (EEZ), a region where we lacked the permission related to all work below the ocean surface. “The multi-beam for seafloor mapping was turned off as it could have been detected, but all other work such as water sampling, ice coring and CTD (ocean profiles) were continued as we assumed we would eventually get the permission – which we fortunately also did,” says Michael. “Had we not gotten the permission, all samples taken within the EEZ had to be thrown away and the CTD-data erased”.
 |
Figure 2: Time-series of hourly-averaged surface temperature (in degrees C; red contour; left axis), wind speed (in m/s; blue contour, right axis) and cloudy conditions (gray circles indicate clouds; shown at the top of the figure) measured during the ARTofMELT expedition. The vertical dashed colored lines indicate the time interval when Oden was within sea ice (in black), and attached to an icefloe during the first (in red) and second (in blue) ice camp. The dashed colored lines match the dates marked in Fig. 1 by stars. Courtesy to Michail Karalis for making this figure. |
Main objective of the expedition: study strong southerly inflow of warm and moist air – so-called atmospheric rivers (ARs) – and their effect on the ice surface in triggering the melt of sea ice and snow in the Arctic. Did we capture it?
“The second point in why the expedition did not go as planned is that we did not get any long-lasting ARs, even though at least a few were expected to occur during the 6-weeks long expedition,” Michael explains. Figure 2 shows the evolution of surface temperature (in red) measured during the expedition. During the first ice camp (shown with red vertical dashed lines in Fig. 2), temperatures increased slowly from close to -15 degrees C to almost melting temperatures towards the end of the ice camp #1. This increase in temperature and cloudiness was associated partly with remnants of an AR traveling westwards north of Svalbard – but it was too weak as it arrived to us. I remember the last day of ice camp #1 to be cloudy, foggy and quite warm when we were out on the icefloe to pack up our equipment – but this event was not yet the trigger of melt onset.
“According to the forecast models, the melt was supposed to start around 4-6 June, when the surface temperature was supposed to exceed zero degrees”, Michael explains, “but the airmasses originating from Greenland were too dry so that we had clear sky conditions instead of cloudy conditions. The surface did not receive as much energy as it would have in the presence of clouds, and thus, the surface temperature increased only up to -1.5 degrees C.” In Fig. 2 you can also clearly see the diurnal fluctuations of the temperature in the middle of ice camp #2 and how the temperatures stayed below zero degrees. Even here, Michael had another hard decision to make: As the melting did not start as forecasted, should we pack-up everything and find another icefloe for the last week of the expedition and hoping to capture the melt onset then, or should we stay at the current icefloe? Staying at the current icefloe and make the ice camp #2 to the last final ice camp involved several risks. “We were drifting southwards in a fast speed and there was a risk that we would drift all the way to the marginal sea ice zone,” Michael says, “and the more we drift southwards, the bigger of a problem the ice drift becomes. Only a fifth of the icefloe that we were originally attached onto was left at this point – fortunately our part of the floe did not break apart”. Several cracks were visible on the icefloe and parts of it that just yesterday was ice was open ocean the next day. The ice drift and us drifting with it created tension on the ice and mooring lines started to fail. “I had to listen to what the others had to say, both researchers as well as the captain and his crew,” Michael adds,” and the wish was that we would stay at the current icefloe as long as possible in order to get continuous measurements at the same icefloe. So, we stayed – which turned out to be the right decision in the end despite the risks”.
The expedition was approaching towards its end – and still we had not caught what we were after. According to the new forecast, which this time seemed to be even more promising than the first one, we would get an interesting event during the last days of the expedition. This was forecasted to be a real AR as we know it, with an Atlantic path bringing moisture, heat and increased cloudiness from the south towards us. I remember standing out on deck on Friday (9 June) late evening, seeing a cloud band approaching in the horizon. The sunny weather was going to change soon!
The next day during the morning briefing at 8:15, a relief and a feeling of success and excitement filled the room as Michael announced that the spring had finally arrived! The weather was cloudy and foggy and temperatures were above zero degrees. “The conditions a week ago were similar to that what happened on Saturday June 10th, however, this time with low clouds, dense fog and warmer conditions prevailed for the whole day that could bring the surface to melt,” Michael explains. “The temperature persistently went above zero around 6:10 in the morning, but I could already know that the melting would start because of the rain early in the morning. I actually feared that we would miss the melt onset, but it finally came at the end of the expedition. It was great to be in the Arctic to obtain valuable observations before and during melt, which allows us to study processes leading to melt and what actually triggered it. Unfortunately, we were not able to study processes what happened after the melt onset, as we had to leave the icefloe the day after the melting started”.
As these conditions prevailed for the whole Saturday, all ice work activities were postponed to the next day – or until the conditions got better. It was just too risky to go out with poor visibility as we had several polar bears wandering around. “Although the polar bears were lovely to watch, in combination with the low visibility and the forecasted storm ahead of us, we were forced to leave the ice camp earlier than I would have liked to”, says Michael. “Packing up the met-station thus happened in conditions that would normally not have allowed work on the ice, but with extra guards on the ice and look from the bridge an exception was made. Another alternative would have been to leave everything on the ice and return to the ice a few days later (13th of June) after the storm. However, another storm was expected for the 14th (the day when we were supposed to be back in Longyearbyen by midnight), which would have made our transit to Svalbard challenging”. So, we packed-up everything and left the icefloe already on Sunday (11 June) afternoon one day before the storm hit us with strong windspeeds (see blue line in Fig. 2; right y-axis for windspeed).
For the final day (12 June; the day after we left the ice camp #2 but we were still surrounded by sea ice), advanced plans were made to use the helicopter to lift two researchers onto the ice next to the ship, as melt ponds already started to show (melt ponds were the targets for some researchers onboard). However, even this plan was abandoned due to the risk of fog formation within the helicopter. Our pilot Sven emphasized: “If a polar bear comes and soaking wet people (it was raining) need to be packed into the helicopter, it will take up to 10 minutes before the fog inside disappears with the engines running, and only then we could take off”. So, for Monday (12 June), we stayed put within the sea ice and waited for the storm to pass. Only work (securing, packing and removing equipment) onboard Oden were allowed.
We left the sea ice on Tuesday (13 June) morning and ended up circling in the fjord for one day before we could dock outside Longyearbyen on Wednesday (14 June) eve. If you look closer at Fig. 2, you can also see that the storm on the final day was not the only storm we were hit by during the expedition: windspeeds up to 27 m/s were reached during the strongest storm in-between ice camp #1 and #2 (around 25 May), but strong winds with blowing snow were also measured and observed at the beginning of the expedition (around 13 May), as well as in the beginning of ice camp # 2 (30 & 31 May).
New findings?
Even though the expedition did not go as planned, as discussed in the previous two sub-chapters, new exiting findings and experiences were collected during this expedition. As much of the data still need to be analyzed, during which new findings most likely will arise, the following points are just a few examples of the outcome of the expedition so far.
“This expedition involved many unexpected events and new findings,” Michael tells, “For example, shortly after that the melt onset began early on Saturday morning and temperatures permanently stayed above zero degrees, we could see clear-blue melt ponds (or the locations where they are going to form) forming on the ice. This was very unexpected to happen so quickly after the onset of melt”. Another interesting observation from this expedition is the differences in the time it takes to transit from winter to summer (to melt season) compared to from summer to winter (to freezing season). “Most campaigns (as those I have participated in) in the Arctic Ocean are in late summer or autumn due to a better accessibility with lower sea ice extent. Thus, the freeze-up of sea ice has been studied more compared to the timing of melt onset, which is one of the reasons we were in the Arctic this early. The transition from summer melt season into the winter ice-growth season happens quickly: the freezing of sea ice starts directly as soon as the energy budget at the surface becomes negative (i.e., surface loses energy to the atmosphere and the surface is cooling). In spring, however, this expedition has showed that melting is not quick. On the contrary, there is a whole chain of processes that in the end lead up to the ice melt onset. Thus, the surface energy budget needs to be positive for a sufficiently long time (surface receives more energy from the atmosphere than what it loses, surface is warming) so that the temperature exceeds zero degrees and the melting begins.” It will be interesting to get the whole picture of these processes involved in the chain of processes leading to melt onset, which will be possible by combining all the diverse research and observations that was made during this expedition by the talented researchers from 12 different work packages.
“Participants of each work package had specific wishes before the expedition, and we tried to fulfil everyone’s wishes,” Michael says, “we also managed to exceed some of the expectations. For example, we ended up with double the amount of helicopter ice stations that what was determined from the beginning. During these helicopter ice stations, more interesting findings were made. For example, biological activity, such as algae production under the sea ice, was observed both before the melt onset but also, it returned after a longer period of colder conditions once the final melting began.” A picture showing algae below sea ice during one of the helicopter ice stations can be seen in the next (last) posting.
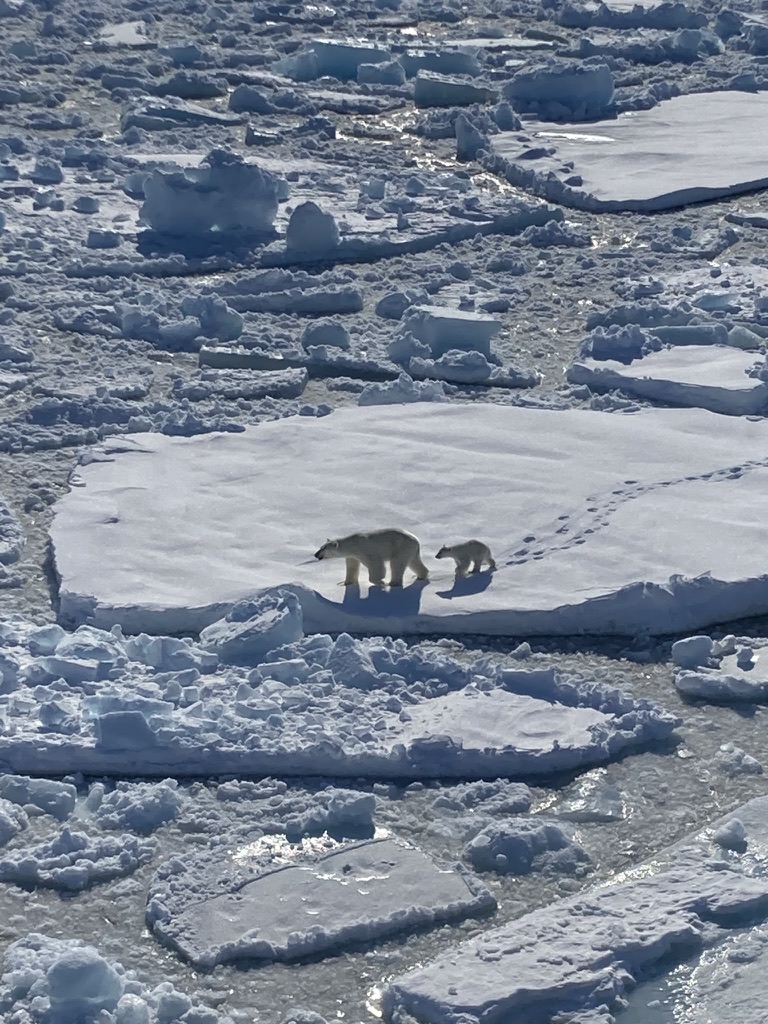
“And of course, during these 6 weeks we had unexpectedly many (31) curious polar bear visits”, Michael says, “and also polar bear cubs, which were wonderful to see and to photograph”.
What now?
“We sent in the application for this expedition in October 2020 and it got accepted in January 2021,” Michael tells, “We received financial support for 50 % of the research spots on Oden (which includes about 20 people) and the other half should be filled with other scientists, both international and national”. In the next 2 years until the expedition, a lot of planning work was included. Additionally, several workshops among the possible participants were held, from which two were online zoom meetings due to the pandemic and one, that was held in October 2022, was the first in-person meeting. In April 2023, we had a one-week long mobilization on Oden in Helsingborg, where practical preparations for the expedition were done. Now we have returned from the expedition, but the work does not stop here. Demobilization was held in Helsingborg in the beginning of July. “The next tasks are to write a cruise report, where the expedition together with all the work conducted during the expedition and preliminary results will be explained and presented in more detail,” Michael Tjernström explains, “and we also need to provide metadata and process data obtained during the expedition and then make it available for the whole science community. Then there will be lot of data analysis and presenting preliminary results on conferences. I also plan for a post-expedition workshop one year after the expedition, i.e., in spring 2024, where all participants of ARTofMELT will be invited and we can discuss among us the findings in more detail – and where to go next”.
So even though the expedition did not turn out as wanted or planned, it was still a great success with many new findings, lot of data collected, new collaborations and friendships were formed and several new impressions and memories arose to keep for life.
In the end, I want to repeat the main goals of this expedition as I presented in the end of my very first posting in this blog:
--> The main purpose of this expedition is to be in the Arctic before the melting of sea ice starts and then capture the rapid melt onset.
--> We want to investigate which processes are involved in triggering sea ice melt.
--> For this, we want to obtain as much as observations from the spring and this rapid transition as possible. Observations from the Arctic are rare!
--> Our main target is to capture so-called Atmospheric rivers (ARs), narrow bands of warm and moist air transported in the atmosphere from the south towards the Arctic. We hypothesize, based on model- and a few observational studies, that these rivers are important triggers for the onset of sea ice melt.
--> We need to be in the Arctic on the right place at the right time, which requires collaboration with on-shore colleagues that will follow carefully the forecasted weather. Not only does the thicker ice-conditions in spring entail challenges, but also the planning of the route of the trip during the expedition will be challenging.
--> In-situ observations from the spring help us understand processes behind the sea ice melt onset and improve the process-based understanding in climate and weather models that still fail to represent the Arctic climate properly.
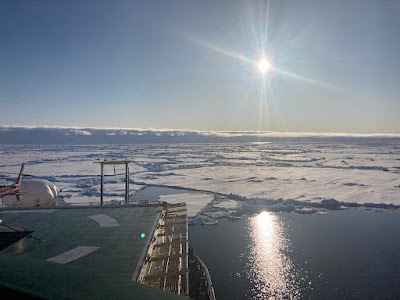
Finally, I want to end with showing you two photos from the expedition, taken in the north Greenland Sea on Monday 5 June.


Comments
Post a Comment